
Until now, Cage Calculus’s previews have relied on its ELO algorithm, as well as subjective fight picks by yours truly, the editor. However, you all surely come to Cage Calculus hoping for more of a silver bullet/Moneyball approach to MMA forecasting. In 2024, the traditional Cage Calculus algorithm only projected the correct outcome in 57.1 percent of fights. While that is very close to the expected amount (57.7 percent) given the percentages produced by the algorithm, there’s no doubt our followers are hoping for something more incisive than a pure ELO model.
The regular Cage Calculus algorithm (which will still be run and employed after this, to be sure) relies almost exclusively on a fighter’s resume and results. Their rating is determined by their wins and losses, the quality of opponent they’ve fought, how many titles they’ve won, and how prolific a finisher they are. However, the algorithm does not factor stylistic matchups into account. That occasionally produces some wonky numbers.
For example, Henry Cejudo is still ranked as the best bantamweight according to the Cage Calculus ratings. This comes despite Cejudo getting ragdolled by the current champion, Merab Dvalishvili, the last time they fought. This is because Cejudo is a former two-division champion. The algorithm sees that and says, surely Cejudo should beat Dvalishvili. However, anyone with eyes after that fight could see Cejudo was a step behind Dvalishvili.
CageCalc+ seeks to right that wrong and produce a prediction model that is more suited to individual matchups, rather than taking a holistic picture of a fighter’s resume. Here are the factors considered by the new CageCalc+ algorithm:
- How often a fighter goes to a decision
- How often a fighter wins decisions
- What percentage of their wins are by submission
- What percentage of their wins are by KO
- What percentage of their losses are by submission
- What percentage of their losses are by KO
- How many strikes they land per minute on average
- How accurate they are as a striker
- How successful are they at defending strikes
- How many takedowns they land per 15 minutes on average
- How accurate are their takedowns
- How often do they defend opposing takedown attempts
- Reach Advantage
- Is one fighter making his or her UFC debut?
- Is one fighter taking the bout on short notice?
- Each fighter’s traditional CC Rating
- The implied odds based on FanDuel’s betting lines
- Whether one or both fighters are ranked by the UFC (and how highly)
All of that is synthesized, weighted and used to produce a CageCalc+ score for each fighter. This is accomplished by putting these statistics into eight different matrices that ultimately create each fighter’s final score:
The Decision Matrix
This Matrix is created by multiplying together the percentage of a fighter’s bouts that go to the judges (in decimal form) and that fighter’s win percentage in decisions (the whole number). For example, a fighter who goes to decision 50 percent of the time and wins 75 percent of them would have a Decision Matrix of 37.5 (0.50 x 75). The Decision Matrix has a weight of 0.33.
The Submission Matrix
This Matrix is created by averaging together the percentage of a fighter’s wins that come by submission and their submission defense (the percentage of their losses that are not by submission). If a fighter has a submission rate of 60 percent and their submission defense is 80 percent, their submission matrix score would be 70 ([60+80]/2). The Submission Matrix has a weight of 0.33.
The Knockout Matrix
This Matrix is created by averaging together the percentage of a fighter’s wins that come by KO and their KO defense (the percentage of their losses that are not by KO). If a fighter has a KO rate of 60 percent and their KO defense is 80 percent, their Knockout Matrix score would be 70 ([60+80]/2). The Knockout Matrix has a weight of 0.33.
The Striking Matrix
This Matrix is created by averaging together three statistics. The first is the percentage of strikes per minute a fighter is expected to land in a fight (if a fighter lands an average of 6 strikes per minute, and their opponent lands an average of 4 strikes per minute, this means the first fighter would be expected to land 60 percent of strikes, versus their opponent’s 40 percent). The second is the fighter’s striking accuracy. The third is the fighter’s striking defense.
The first statistic in this set is single weighted, the second is double weighted, and the third is triple weighted. So, if a fighter is expected to land 60 percent of strikes, has an accuracy of 50 percent, and a defense of 55 percent, their Striking Matrix would be 54.167 ([60+50+50+55+55+55]/6). The Striking Matrix has a weight of 0.5.
The Grappling Matrix
This Matrix is created by averaging together three statistics. The first is the percentage of takedowns a fighter is expected to land in a fight (if a fighter lands an average of 6 takedowns per fight, and their opponent lands an average of 4 per fight, this means the first fighter would be expected to land 60 percent of takedowns, versus their opponent’s 40 percent). The second is the fighter’s takedown accuracy.
The third is the fighter’s takedown defense. However, this is tempered by a fighter’s submission rate. Many fighters will allow themselves to be taken down because they trust their submission abilities. So, this statistic is calculated by adding their actual takedown defense to a number calculated by multiplying their percentage of failed defenses by their submission rate. If a fighter has a takedown defense of only 20 percent, but their submission rate is 70 percent, their CageCalc+ takedown defense would be 76 (20+[80×0.7]).
Each stat is single weighted. So, if a fighter is expected to land 60 percent of takedowns, has a takedown accuracy of 50 percent and, like the hypothetical fighter above, has an adjusted takedown defense of 76, the fighter’s Grappling Matrix would be 62 ([60+50+76]/3). The Grappling Matrix has a weight of 0.5.
The Reach Matrix
The Reach Matrix is simply applying the following probabilities to each fighter based on the reach difference between the fighter, with the longer fighter getting the higher percentage and the other getting the smaller.

So, a fighter with a 3-inch reach advantage would have a Reach Matrix score of 54.88 and his opponent would have a score of 45.12.
The Circumstance Matrix
This Matrix accounts for a fighter’s ranking and whether their opponent is taking the fight on short notice or is making their UFC debut.
For rankings, a champion receives a score of 100. A number one contender receives a 93.75. Each subsequent ranking subtracts 6.25 from the previous one. A 15th ranked contender gets a score of 6.25. Any unranked fighter gets a 0.
If a fighter is fighting an opponent who is making their debut, the fighter receives an additional 57 points (as debut fighters lose 57 percent of the time roughly). If a fighter’s opponent is taking the fight on short notice, the fighter receives an additional 65 points (short notice fighters lose 65 percent of the time).
So, a 14th ranked contender fighting an opponent who is making their debut on short notice will have a Circumstance Matrix score of 135.5 (13.5+57+65). The Circumstance Matrix has a weight of 0.33.
The Probability Matrix
This Matrix is calculated by combining the Cage Calculus Rating win probability with the implied odds from the Vegas betting odds. The formula is as follows:
- [(0.571 x CC Odds) + (0.704 x FanDuel Odds)]/1.275
The Probability Matrix has a weight of 0.41
Those weighted Matrix scores are then added together to produce a final CageCalc+ score. They are then weighed against the other fighter’s score to produce an adjusted win probability. The formula used to produce that probability for a hypothetical “Fighter A” is as follows (with A representing the rating for Fighter A and B representing the rating of their opponent):
- 1 / [1 + 10^((B – A)/165)]
This is almost exactly the same as the algorithm to create probabilities for fighters based on the traditional ratings, but the denominator is changed from 400 to 165 for the CageCalc+ probabilities, because CageCalc+ produces smaller numbers overall and needs to be more sensitive to changes.
Here is a sneak preview of what this will look like for next week’s main event fight, Mackenzie Dern vs. Amanda Ribas:
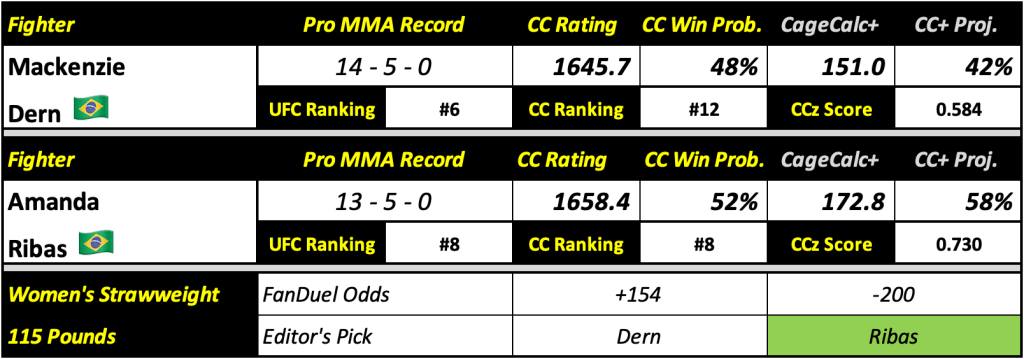
As you can see, based on their CC ratings, Ribas has a slim 52 percent win probability. However, when taking all of the factors above into account and plugged into the new CageCalc+ algorithm, Ribas receives and score of 172.8 for this matchup, whereas Dern gets a score of 151. This works out to Ribas having a much higher projected win probability of roughly 58 percent (though still closer than the implied Vegas odds).
CageCalc+ scores will not impact a fighter’s CC Rating going forward, nor will it impact how new ratings are calculated at the end of each fight. The pure ELO model of the traditional CC Rating will continue on and be displayed in every preview as normal, just with the added information of the CageCalc+ metric. The accuracy of the CageCalc+ scores will be tracked in the prediction standings to see if this is a much more accurate model going forward (or if the compiling of said data makes the editor better as well).
